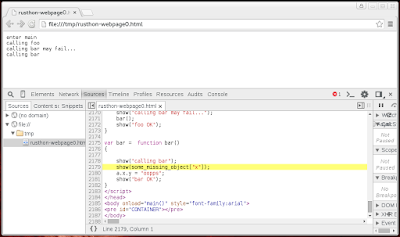
This first reason why people give up when trying to learn JavaScript and HTML, they load up their test page in Google Chrome, and then see this fucking bullshit. It can be a blank white page, or your page half drawn with missing elements...

This second reason why people give up on JavaScript and HTML, they have to press Ctrl+Alt+J to open the god forsaken Google Chrome Developer Tools window. They see some error message in red and then have to click to the far right of it to jump to that point in the code.

Then the user sees the interface above and runs outside to puke. The line that caused the error is highlighted in yellow, for a split second, and then fades out so fast your eye can easily miss it. What the fuck?
Maybe then they give the FireFox debugger and try and see something even more hideous. Then they decide it is time to give up on JavaScript and HTML forever.
A Real JavaScript Debugger

This is the new debugger that is built into the JavaScript backend of Rusthon. When you transpile your project without using the --release command line option, it will insert runtime code to catch any uncaught errors, it parses the trace-back, and generates an HTML interface, with human readable error messages, and editable code that updates without recompile or reload.
note: if you do not include Ace.js in your HTML, then the debugger falls back to using a regular HTML TextArea, which looks like this.

No comments:
Post a Comment